
(aka Senior Mixer or SMX)
Problem
Older adult drivers typically experience age-related declines in sensory, cognitive, and psychomotor abilities that might affect their ability to drive safely. Automation is envisioned as a potential remedy to help these individuals continue to maintain their driving safety and mobility. However, the benefits of automated features or advanced driver assistance systems (ADAS) depend on a variety of factors including trust, acceptance, adoption, understanding, as well as usage patterns and the ability to realize the full benefits of such systems. The objective of this study was to investigate whether ADAS can benefit mobility and driving performance of older adult drivers.
Methods
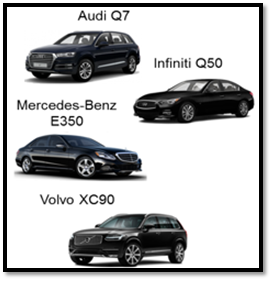
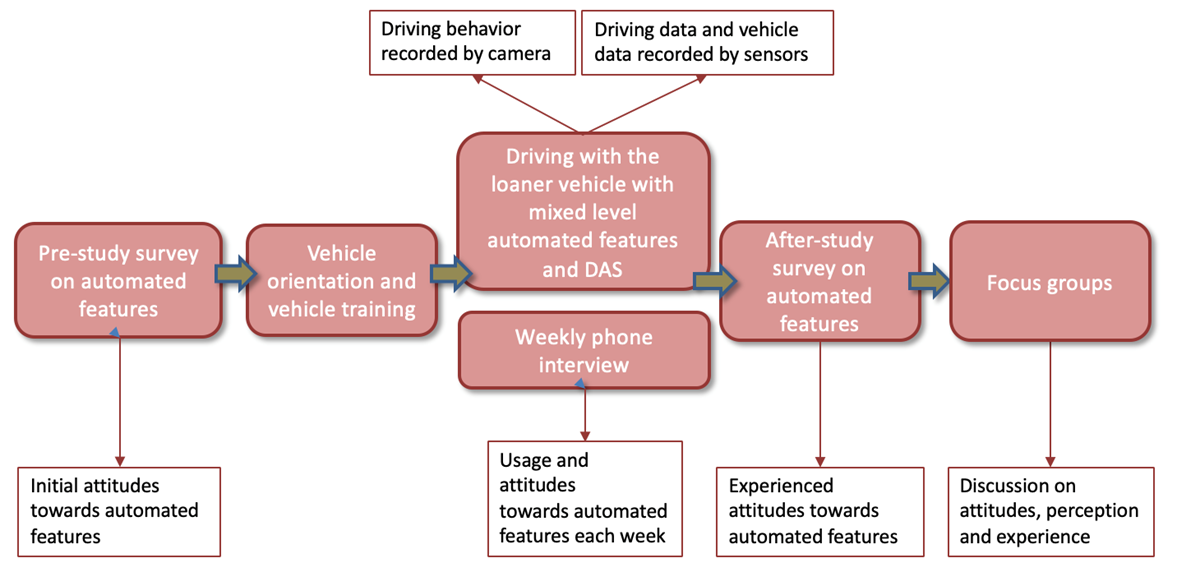
We conducted a naturalistic driving study, recruiting 18 male and female drivers aged 70-79 to drive ADAS-equipped vehicles for six weeks each. The ADAS features each vehicle had in common were blind spot alert (BSA), lane departure alert (LDA), lane keep assist (LKA), and adaptive cruise control (ACC). Each participant was given a study vehicle for six weeks. Each vehicle was instrumented with a custom data acquisition system (DAS) incorporating several camera views and other sensors (e.g., GPS and a variety of vehicle kinematics) to collect time-series data on driving behaviors. We also collected data on attitudes towards the in-vehicle technologies at several key touchpoints during their participation.
Pre and Post Questionnaire Subjective Results

Lane control features
- participants perceived fewer false alarms [t(17)=2.61 , p=0.02]
- participants felt more familiar with the lane control features [t(17)=4.25, p<0.001]
- participants felt safer [t(17)=2.61, p=0.02]
- participants felt greater confidence in the lane control features [t(17)=2.29, p=0.03]
Acceleration and braking features
- participants perceived fewer false alarms [t(16)=3.73, p<0.01]
- participants felt more familiar with the acceleration and braking features [t(17)=3.43, p<0.01]
- participants felt marginally safer [t(17)=2.11, p=0.05]
- participants had greater confidence in the acceleration and braking features [t(17)=2.33, p=0.03]
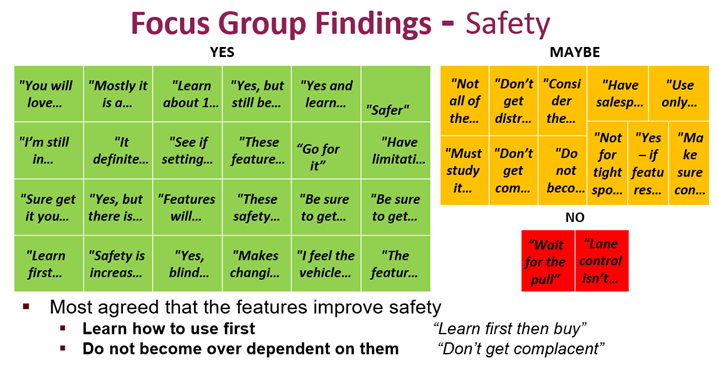
Focus Group Findings
Attitudes
Negative initial attitudes towards the advanced features; positive post-exposure attitudes towards the advanced features
Safety Perception
Most agreed that the features improve safety
Driving Performance Analysis
Comparison between two matched datasets:
- SMX
- SHRP 2 (Penn State site)

Result
Driving Performance: SHRP2_PENN vs. SMX
| Measure | Test Statistics | Degrees of Freedom | P-Value |
|---|---|---|---|
| Number of lateral events/km | T = −1.74 | 28.88 | 0.09 |
| Variance in acceleration magnitudes across lateral events | T = 24.49 | 32.15 | <.001 |
| Number of longitudinal acceleration events/km | U = 106 | – | <.001 |
| Number of longitudinal deceleration events/km | U = 412 | – | 0.002 |
| Variance in acceleration/deceleration magnitudes across longitudinal events | T = 4.19 | 29.80 | <.001 |
Note: T = Welch’s t-test; U = Mann-Whitney-Wilcoxon test
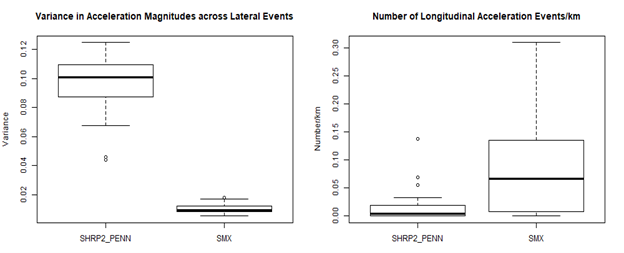
Variance in acceleration magnitudes across lateral events (left) and number of longitudinal acceleration events/km (right) of SHRP2_PENN and SMX.
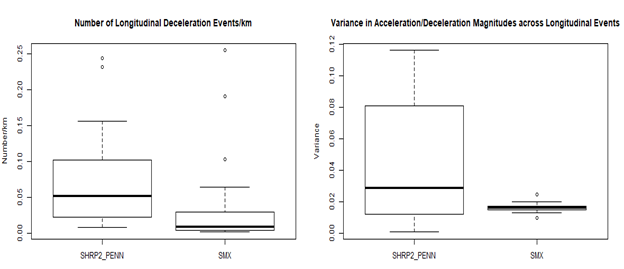
Number of longitudinal deceleration events/km (left) and variance in acceleration/deceleration magnitudes across longitudinal events (right) of SHRP2_PENN and SMX.
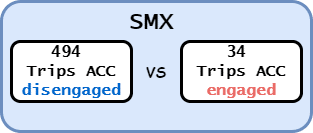
Comparison of Trips Between ACC Disengaged and Engaged in SMX
Result
Comparison of Trips Between ACC Disengaged and Engaged in SMX (Sample Size: 494 for ACC Disengaged and 34 for Engaged)
| Measure | Test Statistics | df | P-Value |
|---|---|---|---|
| Number of lateral events/km | U = 9,724 | – | 0.12 |
| Max lateral acceleration | T = 0.08 | 38.52 | 0.93 |
| Number of longitudinal acceleration events/km | U = 11,488 | – | <0.001 |
| Number of longitudinal deceleration events/km | U = 8,013 | – | 0.56 |
| Max longitudinal acceleration | T = 2.37 | 37.99 | 0.02 |
| Max longitudinal deceleration | T = 1.33 | 38.41 | 0.19 |
Note: T = Welch’s t-test; U = Mann-Whitney-Wilcoxon test
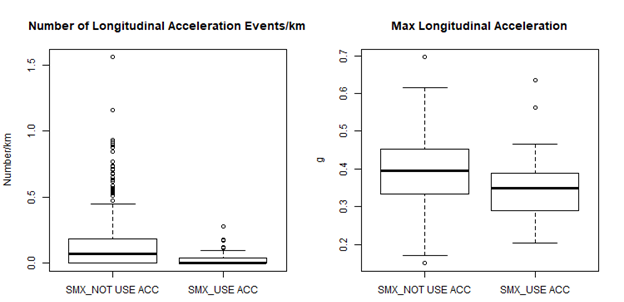
Number of longitudinal acceleration events/km (left) and max longitudinal acceleration (right) for trips in SMX without and with ACC engaged.
Driving performance findings
Lateral control performance
- Seniors who drove ADAS-equipped vehicles (SMX) had smaller variance in acceleration magnitudes across lateral events than seniors who drove conventional vehicles without ADAS (SHRP 2_PENN) – more stability and better lateral control performance for seniors driving the ADAS-equipped vehicles.
- There were more lateral events per kilometer for SMX trips when ACC was engaged vs. ones where it was not – ACC might in some way hinder lateral control performance.
Potential reasons for the inconsistent results on lateral control performance: 1. confounding factors, such as traffic environment and car models; 2. the influence of other ADAS, particularly LKA and LDW, have been demonstrated to affect lateral vehicle control; 3. negative behavioral adaptation that occurs after introducing ACC.
Longitudinal control performance
- There were smaller variances in acceleration/deceleration magnitude across longitudinal events – Equipped with ADAS may help seniors better manage their speed, for example, reducing hard braking, which can help with headway management.